
TL;DR: Building reports and analyzing data in GA4 is as simple as working with a drag and drop tool. In this article, you will get to know the two easiest and quick-start ways of building reports in GA4 and how to use the new customizations they offer over the traditional UA methods of reporting.
We have seen big friction in acceptance of GA4 simply because the flat tables and trend line reports we had in UA don't exist in the standard part of reporting (maybe in the future). For many UA users, this new system of consolidated reporting and new method of processing data does not make sense.
Simplifying the difference between UA and GA4
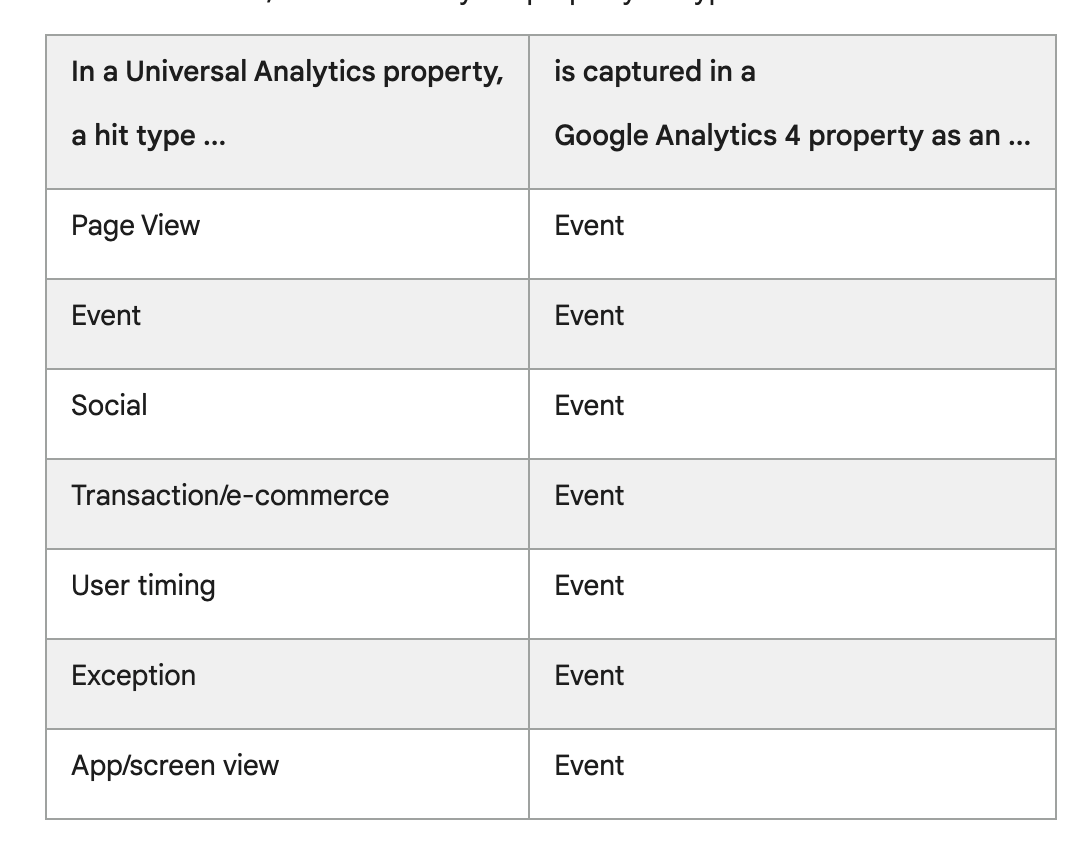
All you need to understand is that the data UA captured from your website came with some labels attached to it in terms of action(hit) performed by the user (When a user lands on your home page, the UA got a hit). In GA4, that is not the same anymore, everything is now an event (when a user clicks on a particular button, it's an event). Although there are some pre-configured events like page_view, which sound and look the same as UA, they do not mean the same.
Many new data points were introduced and as the data model for processing the incoming data changed, some metrics did not make sense and had been removed. (RIP: Bounce rates, Avg session duration)
Let's understand the basic difference between the 2 platforms
How to get started with data reporting in GA4?
The events
Here is a list of events needed for collecting the correct data from the store. (Look for the list related to eCommerce business only. Based on CMS you use, the method of the configuration might change). These are the most basic ones, you can set up additional events you think are important for your website too.
The process of creating the event tag using google tag manager can be found here, and if you are looking to migrate the events you have in UA to GA4, here is a support article that will help you.
Setting up the reports
The new shopping behavior report in GA4
This is just like the traditional UA shopping behavior report you used to get under the eCommerce section. It still tells you the behavior of the user on your website.
However, this new version allows you to customize the funnel as per your need. Assume you had an email nurturing stage in your journey, With GA4 that data can directly be added to the funnel report as a stage and can be analyzed together vs UA where you just have new vs returning users. This allows you to have greater depths and segments for analysis without moving much in the tool.
Getting started:
Steps1: In your GA4 Property access the “Explore” menu in the sidebar.

Step 2: Select the “Funnel Exploration” option from the templates and you will be greeted with this a new screen.
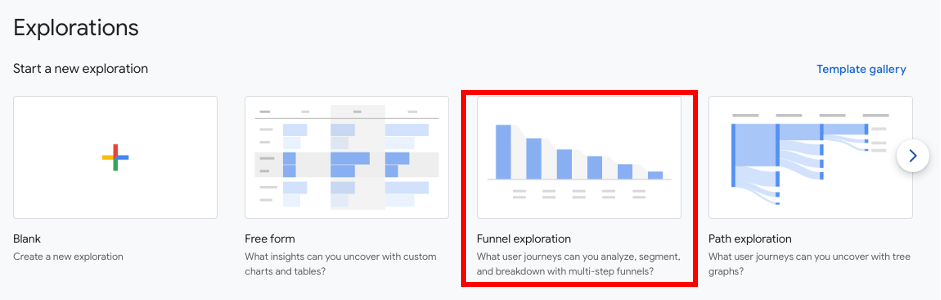
That looks something like this

Or has a chart that looks like this

Either way, let’s start building the chart or if you have this chart already check it against the method we suggest here.
Step 3:
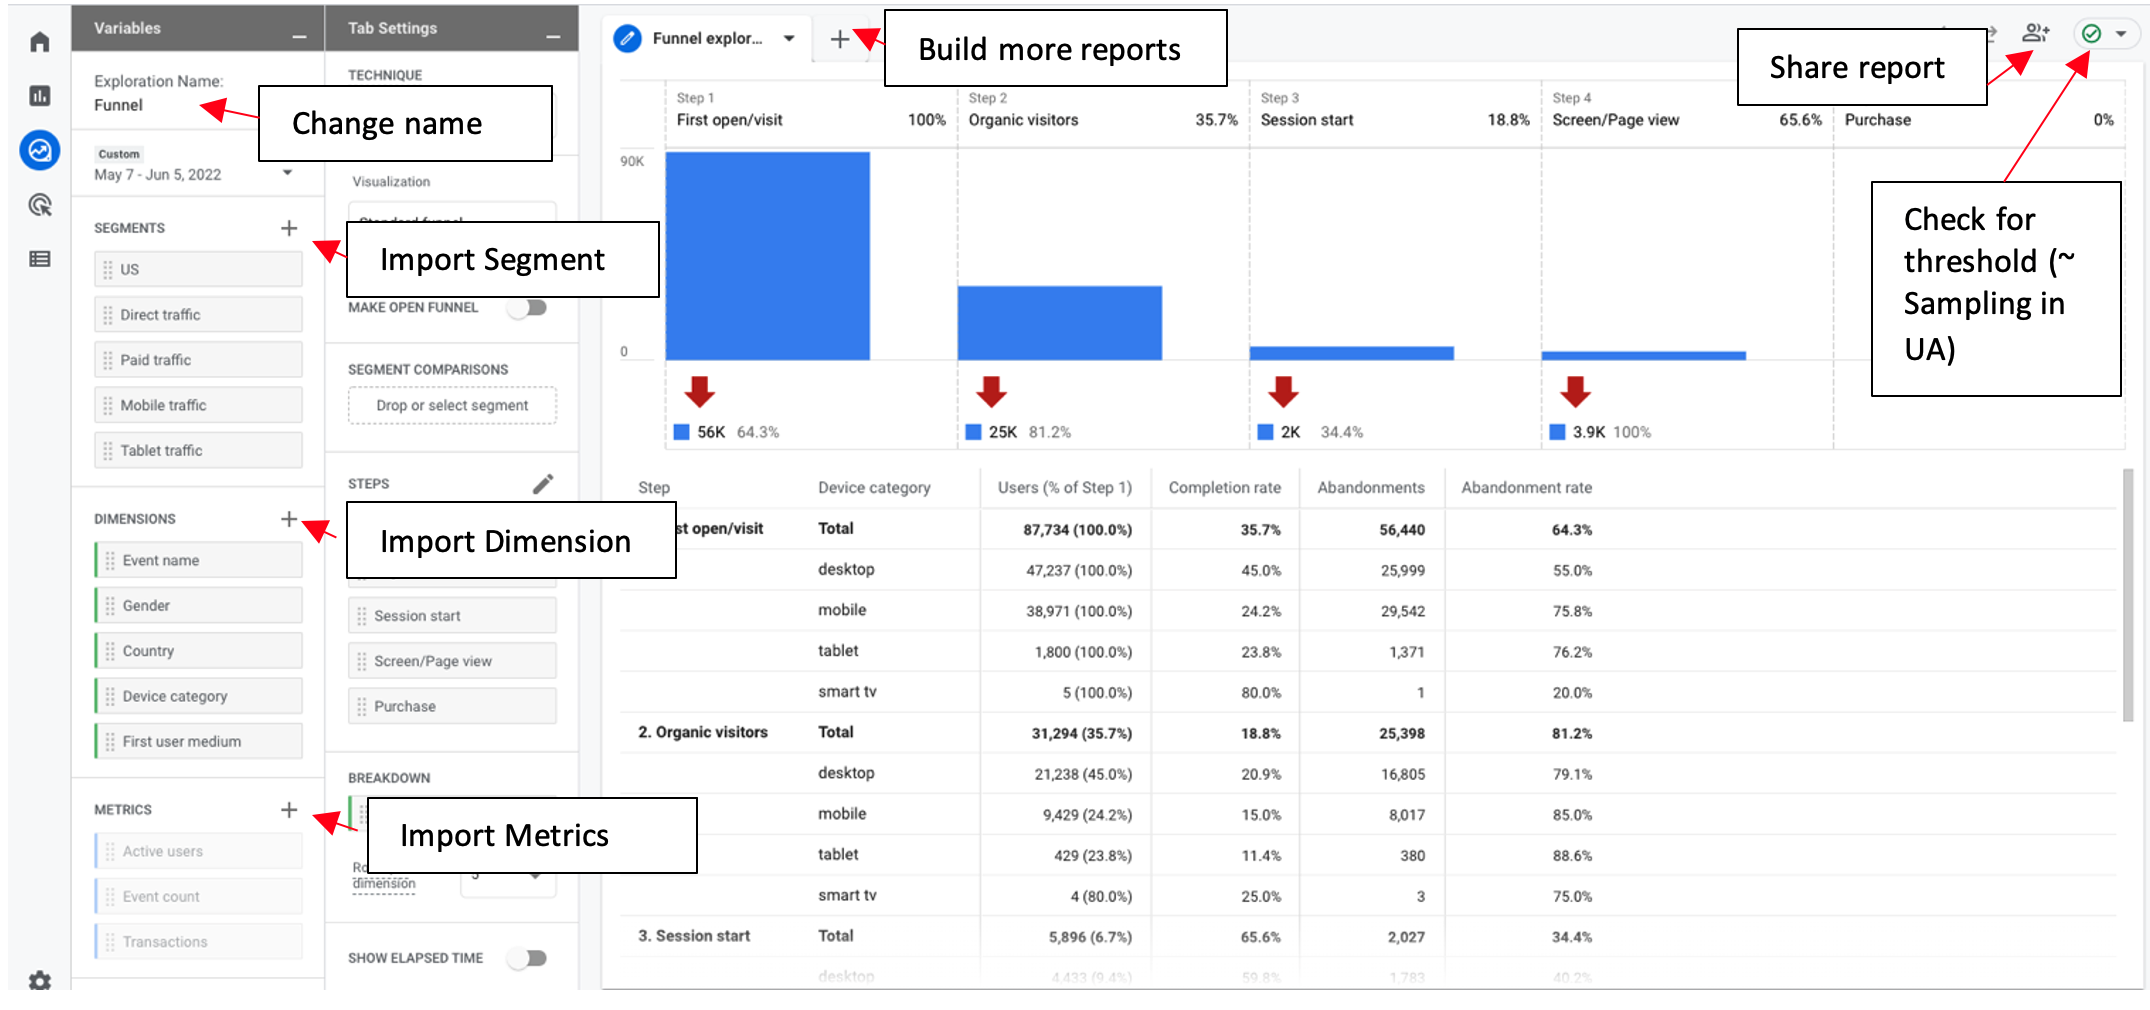
Under the tab settings side menu, look for “Steps” (This is where the magic really happens). Click on the [✏️ ] icon and a side drawer will popup asking you to add steps into your funnel.
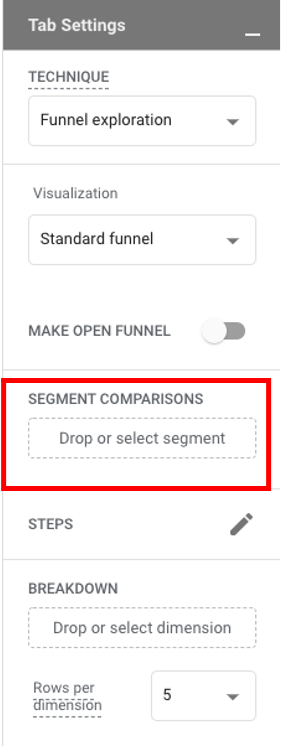
Adding funnel steps is quite straightforward. Add the “Step name” and the event it represents.

For the first step: Add the name “Landed on the website” or anything you’d like and in the “Add new condition” search bar look for the event “Session_start”

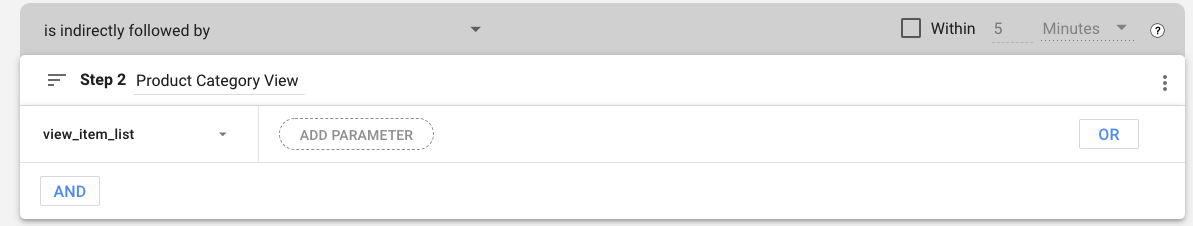
For the second step: Add the desired name and add the event “view_item_list”.
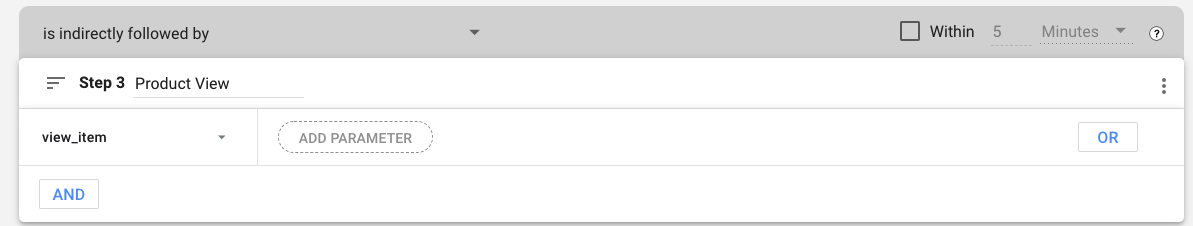
For the third step: Add the name and in the “Add new condition” search bar look for the event “view_item”
For the fourth step: Add the name of the step and in the “Add new condition” search bar look for the event “add_to_cart”

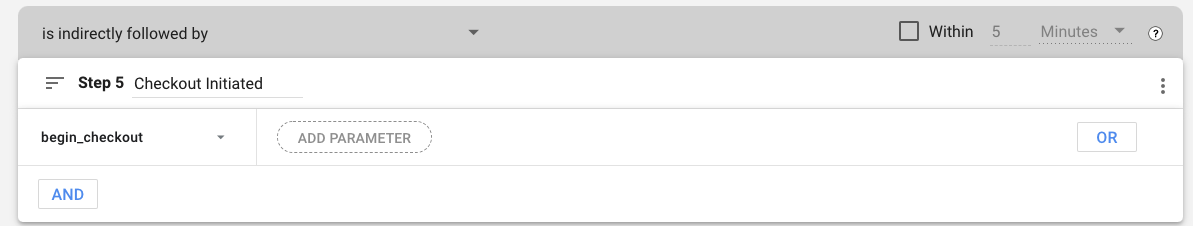
For the fifth step: Add the step name and in the “Add new condition” search bar look for the event “begin_checkout”
Note: Events from steps 2 to 5 need to be added manually (Using GTM or in the code) for now on to your website for GA4 to collect the data. If you have additional steps in your funnel just create the step and add the right event for it.
These event names are case-sensitive. While the step title can change but the events need to match exactly as it is set up on your website.
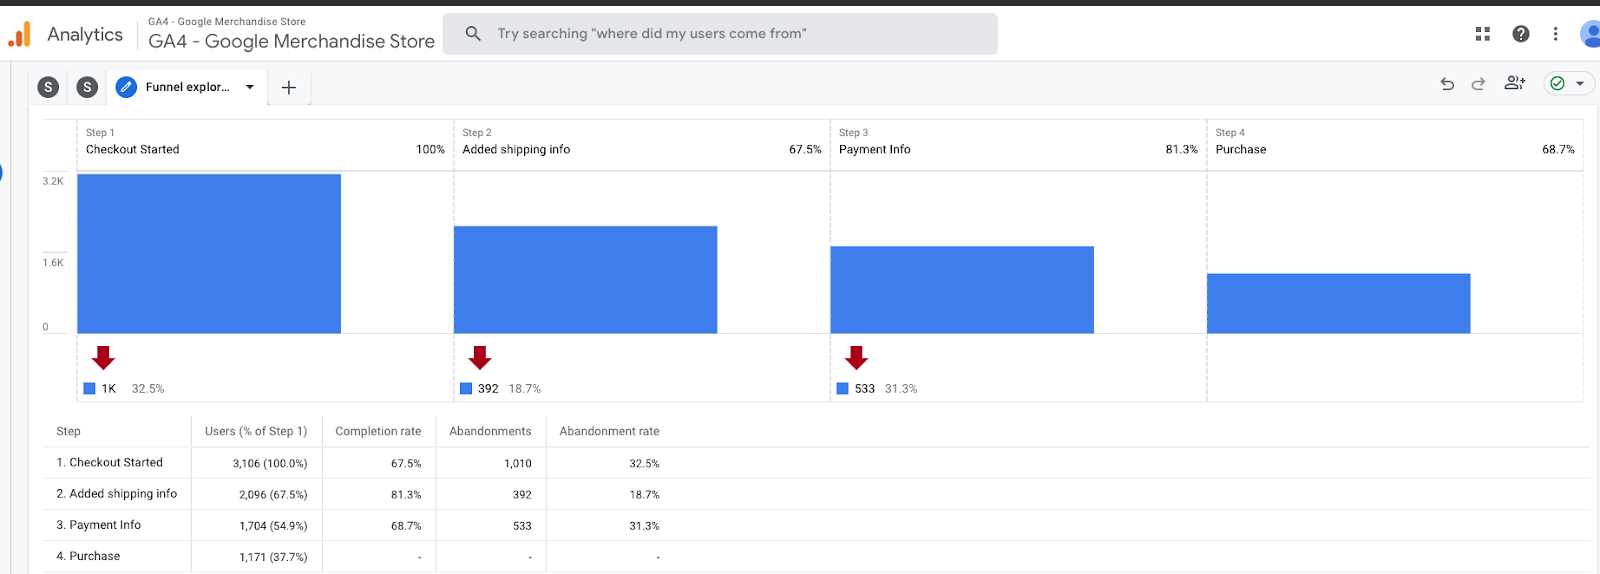
The final chart should look something like this:

Furthermore, you can also set up a checkout behavior funnel by clicking on the “+” icon next to the chart name.
The funnel steps and events are in the following image.
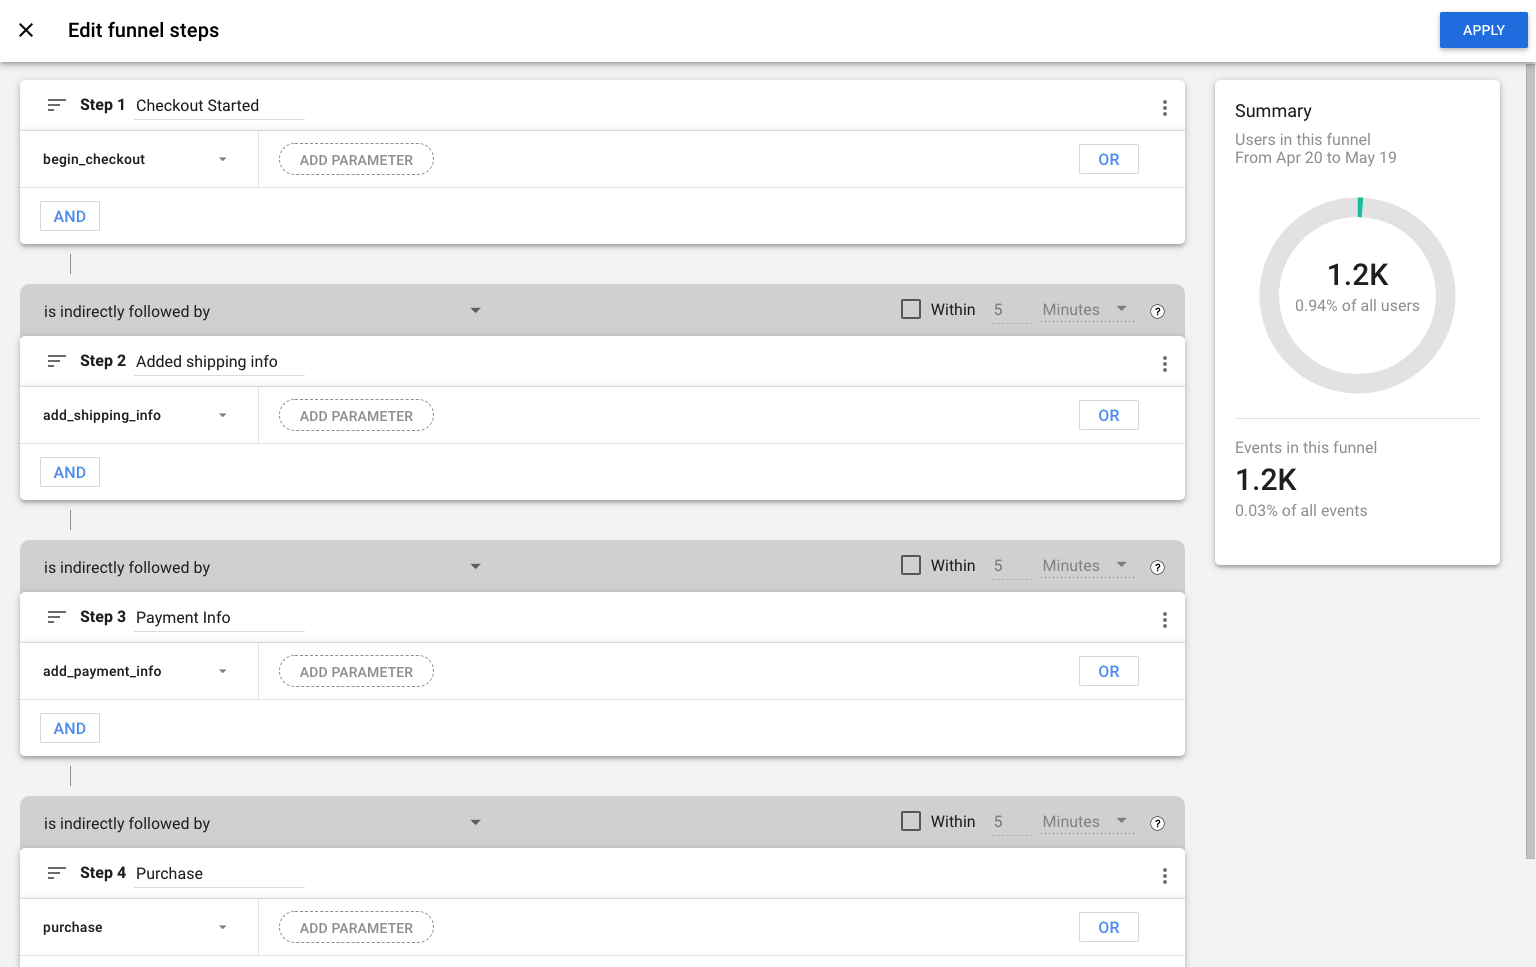
The final chart should look something like this
Tip 1: Add Default segments/Dimensions or create new segments/event-based dimensions to this funnel to quickly view how the behavior changes.

Tip 2: A screen walkthrough to explain the Basic UI
Build a Reports Snapshot in GA4
You have to try the reports snapshot, These are just like UA dashboards but more customizable. You get prebuilt charts in the form of cards that can be added or removed from these dashboards. These cards appear as boxes containing the data and information for a particular dimension or metrics, you can access additional information and options for a Card by clicking it to open its Details view.
The best thing about reports snapshot is that they can be customized as per your need, Unlike traditional UA reports where tables and charts were only found in one place i.e. under a particular option group. You can now look at and analyze data that need not belong to the same report and gather better insights by connecting dimensions and metrics from different data groups.
Getting started:
Step 1: Go to the “Reports” section using the side navigation

Note: Before you even start working on this, perform the following:
[Whatever the default report snapshot looks like, make a copy of that. Here are the steps for doing that.
- Click Customize report [✏️] in the upper-right corner of the report
- Without changing anything look for the [💾SAVE] on the right top of the screen.
- Click on the button and click on “save as a new report"
- Make a copy to preserve the original report and open a copy for editing
- Clicking Edit or Make a copy causes the report builder to appear. You can later access this report by clicking the library menu at the bottom of the nav bar]
You can use the same process to build snapshots and save them for different purposes.
Step 2:
Next, In the main report snapshot view by clicking on the Customize report [✏️] in the upper-right corner remove all the default cards (leave those which you want).
Add the first card:
Access the drawer of the card by clicking on Customize report [✏️] in the upper-right corner > click on “Add card” > On the side drawer look for the tab “other cards”.
Look for a card named: “Total Revenue, +2” (+2 are the other 2 metrics that will be visible on the same card”
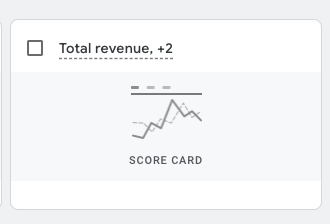
After checking the card, click on the Add cart button on the top right corner and it should appear in the snapshot dashboard.
Looking something like this

Add the following cards from the same app drawer:
To know about the revenue
1) Conversions by Default channel grouping
2) E-commerce revenue, eCommerce purchases, Item views
3) ARPPU, Average purchase revenue, Transactions per purchaser
4) Total Purchasers, First-time purchasers
5) Lifetime value
More about your Products performance
6) Product Revenue by Category
7) Quantity by Product ID
8) E-commerce purchases by Item name
To know about the user and website engagement
9) Paid user stickiness
10) Conversions by Campaign
11) Users by Device category
12) User activity by cohort
13) User retention
14) Average engagement time, engaged sessions per user, Average engagement time per session
15) Users, Event count, Conversions, Total revenue
16) Event count by Content type
The metrics selected to add in this snapshot are the indicators of what is happening in your store and business overall. For most eCommerce stores the goal metric is revenue and the channels that bring you the most conversion with AOV. Breaking it further down would be the lead drivers of the revenue, what sells the most and what sells the least with how much is being bought. The next set of metrics is the operational metrics which tell you a lot about the behavior of the user on the website itself. Whenever you are trying to optimize the revenue, you have to start by optimizing the metrics which talk about the user and website engagement.
Note: You can add up to 16 cards in one report snapshot and there are many other pre-built cards you can use to save time in the GA4 report snapshot, Use/replace these with those which align better with your business needs.
Tip 3: Reading a card thumbnail

You don’t have to add a card into a snapshot to know what it shows and if it's the right card for you or not, the card thumbnail tells that:

A card can have the following charts:
- Bar Graphs
- Column Graph
- Scorecard
- Trend line
- Data Table
- Venn Diagram
- Doughnut chart
The number next to a metric name tells you how many metrics will be added to the card, and you can interact with the different metrics on the same card. Some cards provide the option to change the metrics and dimensions based on your needs.
Conclusion
GA4 if anything should make your life easier. You don't have to remember where a particular report lives, you can build all the reports in one place and analyze them together extracting more information from the data you collect.
These charts aim to bring the most important data points to you every day to manage your eCommerce store in one place and hopefully get you accustomed to the new method of analyzing the data. A good thing to do now would be to get started with the right implementation of the GA4 before you start building the reports. If you need help, schedule a free analytics consultation HERE.


.svg)
