

The Diagnosis:
Price moves more revenue in a day than any other lever in your program, but list prices break every assumption standard A/B testing depends on.
For most catalogues, switchback (time-split) testing, split by time rather than by user, is where you start.
Define breakeven before you launch. Commit to acting on the result, whatever it says.
Price is the fastest lever you have. Change a button colour and you might move conversion by a fraction of a percent. Change a price and you move revenue, margin, and volume the same day, across every channel at once. That's why most teams are nervous about touching it. It's also why most of them end up guessing instead of testing. However, this is why pricing is the single biggest lever on operating profit.
I've written this for anyone considering a price elasticity test. What elasticity actually measures, why prices break the standard A/B testing model, which test designs hold up, how to start, and the mistakes that wreck results. I'll use real examples throughout, because price testing is one of those areas where the theory is clean and the execution is messy.
What Does Price Elasticity Actually Measure?
Price elasticity tells you how much demand moves when price moves. Raise price 5% and lose 5% of your volume, and elasticity sits at roughly minus one. Lose less than that and demand is inelastic. You're leaving pricing power on the table. Lose more and demand is elastic, and small price moves will swing your volume hard.
The decision behind the number matters more than the number itself.
Before you test anything, decide what winning looks like. There are three honest answers here, and they pull in different directions.
Holding margin percentage. You raise or hold price and try not to lose volume. The goal is staying flat on contribution while the price line moves up.
Growing total contribution. You accept a lower per-unit margin in exchange for enough extra volume to come out ahead. A price cut only earns its keep here if volume clears a breakeven point you defined in advance.
Buying volume and stickiness. You care less about per-unit economics and more about repeat purchases, new customer counts, and retention over time.
These aren't interchangeable. If stickiness is the goal, report at the customer level, not the order level, or you'll end up measuring the wrong thing entirely. Decide which outcome you're actually chasing before you design anything, ideally mapped against your program's goal tree for experimentation. A test that can't end in a decision is an expense, not a test.
Why Do List Prices Break Standard A/B Testing?
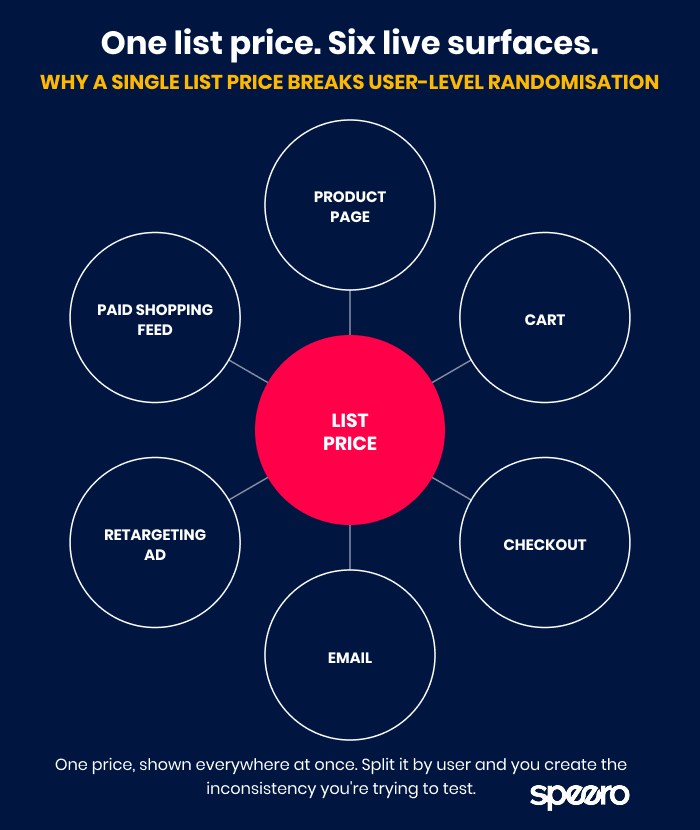
A standard A/B test randomises at the user level. Half your visitors see version A, half see version B, and one element changes between them. That model works because the change stays contained. List prices don't stay contained, and that single fact breaks the standard approach.
Lukas Vermeer and Joshua Tankard documented exactly this in their published analysis of pricing experimentation at Vista. List prices show up everywhere at once, on product pages, in carts, at checkout, in email, in retargeting ads, in paid feeds. Show a customer one price before they land on your site and a different one at checkout, and you didn't run a clean experiment. You've confused or annoyed someone who was ready to buy.
A/B testing gets called the gold standard for good reason, but it only holds up under the right conditions for the right experiment. For list prices, those conditions often aren't there. Vista decided not to build the capability to run traditional pricing A/B tests on their newer platforms at all, because price consistency mattered more to them than testing convenience. Roughly 95% of their price change experiments were never A/B tests (see the chart above, under What Does Price Elasticity Actually Measure headline).
You can still A/B test a price. Just don't wreck the customer experience by forcing it into a model that wasn't built for it.
Which Pricing Test Designs Actually Work?
The right method depends on your catalogue, your traffic, and your tracking, not on a single universal test design. Here's where each option actually fits.
| Method | How it works | Best for |
|---|---|---|
| Estimate from price history first | Estimate elasticity from prices you've already changed, for inflation, competitive response, or any other reason, using the sales data you already have. No live test, no risk to live customers, no cost beyond analysis time. | The fast lane, and most teams skip it. Ask early whether anyone has the price differences and the dates they changed. Only run a live test when that history genuinely isn't there. |
| Switchback testing (time-split or crossover) | Split time instead of visitors: some days run the control price, some run the variant, and you compare the aggregates. The randomisation matters, so a typical cadence alternates the price every seven days over four to six weeks (control week, variant week, control week, variant week), blocked so each group gets an equal number of each weekday. This is the design Vista built into self-service tooling. Testing tools won't analyse switchback for you out of the box, but a spreadsheet handles it cleanly. Full cadence detail and chart below. | Live catalogues where you can't fracture the customer experience, such as a single product page with many fabric or variant options (see the worked example below). It's also the approach we recommended for a complex apparel catalogue. The safest way to start understanding elasticity without breaking price consistency, no traditional A/B test required. |
| Pre-post (interrupted time series) | Change the price site-wide and compare performance before and after a single point of intervention. | Simple to execute; Vista ran over 200 of these in a year for that reason. Not fully controlled, leans on stronger assumptions, and carries high downside risk if conversions drop, so avoid running during peak season. |
| Geo testing | Serve different prices to different regions and compare results. | A fair baseline when you can manage price by region cleanly. Gets complicated fast with mixed customer groups, territories, and account types. If you can't manage it cleanly, don't pretend you can. |
| Duplicate SKU | Clone the product at a new price and route traffic to both listings. | One of the most common ways teams price test, and one of the riskiest. Avoid when product feeds are a major traffic driver: two listings at different prices can confuse Google Shopping and Performance Max, and can get ads disapproved. Precautions on canonicals and indexing help but won't make it perfect, so it needs close monitoring throughout. |
| Fake door | Show a higher price on the front end and drop it at the cart, measuring only add-to-cart behaviour. | Quick and light directional signal. Doesn't capture real conversions: customers may be more likely to convert precisely because the price drops at the cart, which skews how you read the result. |
Switchback in More Detail
Demand follows strong weekly cycles, so allocating days by hand invites confounding. Blocking on weekday, so each arm gets an equal mix, is how you fix that. Repeat the control/variant cycle if you want more confidence beyond the initial four to six weeks. Here's peer-reviewed research on switchback experiment design.
How Do You Start a Price Elasticity Test?
Start with a meaningful move on a high-volume product, not a timid change on a thin one. Signal speed rises with both the size of the price move and the volume behind the product. A 1% change on a slow seller may never reach significance in your lifetime. Pick a top-volume item where a small margin shift has an outsized effect, and make the move big enough to actually detect. Think 5% to 10%, not fractions of a percent.
Before launch, write three things down:
- The volume change the move needs to clear breakeven
- The window large enough to confirm or rule that out
- A commitment to act on the result either way
Model the economics before you risk anything. The formula is simple: breakeven volume lift = price reduction % / (margin % − price reduction %). At a 30% margin and a 5% price cut, you need roughly 20% volume growth just to break even, which implies an elasticity around minus four. At a 50% margin, the same cut only needs about 11% volume growth, elasticity nearer minus two. Higher-margin products forgive price cuts more easily, because every retained sale carries more contribution.
Plug in your real category margins and volumes before you design anything, and if this test is competing with other roadmap ideas for a slot, run it through a framework like the PXL prioritization model so it earns its place for the right reasons. Know exactly what volume response you're betting on before you put money on it.
Time it deliberately. Run during a quiet period, free of promotions or performance peaks. January and February work well for a lot of retailers, because demand softens after the holidays and lets you read price sensitivity without sacrificing peak revenue.
Sort out the operational reality before you go live. Decide how you'll serve a consistent price to customers who visit several times before converting. Handle logged-out and guest users differently from account holders if you need to. Make sure email and retargeting show the correct price for each test period, or you'll blur your own attribution. Confirm you've got enough stock. Agree your success metrics and guardrails up front, things like conversion rate, add-to-cart rate, average order value, units sold, revenue, and overall profitability. Add guardrails too, so the test stops early if something drops sharply.
What Pitfalls Ruin Price Test Results?
Most price tests don't fail on statistics. They fail on execution and framing. Here are the mistakes I see wreck results most reliably.
Testing a price that's wrong for the wrong reason. Sometimes the instinct that a price is too high is correct. Sometimes it isn't. On an RS PRO elasticity project I worked on, the team was convinced some prices were too high and costing volume. The research told a more complicated story. Usability studies found customers saw the brand as high quality for a lower price, and chose it for exactly that reason. Some also read it as a budget option, not because the quality was lower, but because the presentation was simpler. The analytics confirmed it. It was already priced below other brands. Test the price, but understand the perception first, or you'll end up solving a problem you don't have.
Letting outside factors contaminate the window. Site changes, promotions, competitor moves, paid media shifts, and inventory issues all distort price test data. Document everything that happens during the test window, so you can explain the anomalies later instead of guessing at them.
Stockpiling. If customers can buy more at a lower price and just stock up, a volume spike during your price cut is often borrowed demand from next month, not new demand. Check order quantities to see whether this is happening, especially for consumables and bulk-priced items.
Forgetting returns and cancellations. A price move can change refund and cancellation behaviour too. If you aren't tracking those at the product level, a test that looks like a win on gross orders can be a loser on net.
Ignoring sensitive segments. Some customer groups, regions, or contractual accounts shouldn't go anywhere near a price experiment, while others give you more freedom. Work out which is which before you launch. Legal, compliance, and contractual pricing constraints are requirements to clear before you launch, not edge cases.
Not committing to the result. Flat and inconclusive tests are part of the job. Indecision is the actual failure. If you defined breakeven and a decision rule up front, an inconclusive result still tells you something, so act on it instead of relitigating it for the third time. When you're stuck deciding whether to iterate again or move on, our Iterate vs. Move On framework is built for exactly that call.
A Worked Example: Apparel Switchback in Practice
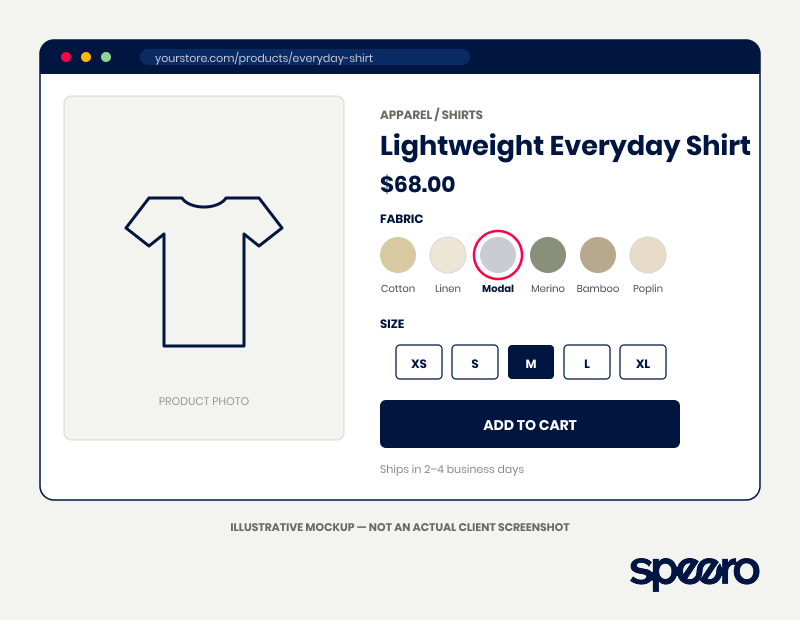
I recommended this exact approach for an apparel client, and it pulls the whole picture together. They wanted to raise prices on their highest-volume fabric to improve margin without losing volume. Duplicate SKU was too risky: Google Shopping drove most of their traffic. A site-wide pre-post change carried too much downside in the wrong season.
So the recommendation was a switchback. Alternate the price weekly over four to six weeks, run it in the quiet January window, monitor daily to catch sharp drops early, and make sure marketing showed the correct price each week.
No testing tool handles switchback analysis natively, so the analysis lived in a simple spreadsheet. Conversion rate, revenue, units, and average order value by period, with a basic significance check on the difference between control and variant averages. Not elegant. Effective. A solid way to start understanding elasticity without major disruption, on a catalogue where the cleaner methods weren't safely on the table.
The Operating Rule
Test a meaningful move on a high-volume product. Define your breakeven and your decision before you launch. Protect price consistency and the customer experience over the convenience of your data. Commit to acting on whatever you find.
Price is the strongest lever you have. Pull it on purpose.
Frequently Asked Questions
What is price elasticity and why does it matter for ecommerce?
Price elasticity measures how much a product's demand moves in response to a price change. An elasticity of minus one means a 5% price increase causes a 5% drop in volume. Values below minus one mean elastic demand, highly price-sensitive. Values above minus one mean inelastic demand, meaning you've got untapped pricing power. Knowing this before you move price is the difference between a calculated decision and a guess.
Can you A/B test list prices directly?
For most catalogues, no, not directly, not without creating more problems than it solves. List prices appear across product pages, checkout, email, and retargeting all at once. Show different prices to different user segments and you get inconsistent experiences that can damage conversion. Time-split (switchback) testing is the more practical, safer starting point for most situations.
What is switchback testing for pricing, and how does it work?
Switchback testing alternates between a control price and a test price across different time periods, usually weeks. Instead of splitting users, you compare performance aggregates across time windows. That sidesteps the customer experience problems of showing different prices at once, and you can run the analysis in a simple spreadsheet, since standard testing tools don't handle this natively.
It's especially useful for catalogues where geo-split or duplicate-SKU testing is impractical or risky. Because a price test still competes for the same roadmap slot as every other experiment, it's worth running it through your normal test prioritization process before you commit resources.
How do you calculate breakeven volume for a price cut?
The formula is simple: breakeven volume lift = price reduction % / (margin % − price reduction %). At a 30% margin and a 5% price cut, breakeven works out to 5 / (30 − 5) = 20% volume lift required. At a 50% margin, it's roughly 5 / (50 − 5) = 11% volume lift. Higher-margin products tolerate price cuts more easily. Run this calculation with your own category margins before you design anything.
How long should a price test run?
Long enough to capture meaningful signal without contaminating it with seasonal noise. For switchback tests, four to six weeks gives you two to three full control-variant cycles. Avoid running through promotional peaks or seasonal extremes. Define the test window before launch, not halfway through because the early results look shaky.
What data do you need before starting a price elasticity test?
Before you launch, get five things in place:
- Historical sales data at the product level.
- Margin data for breakeven modelling.
- Volume data to estimate signal speed.
- A clean way to serve consistent prices across every channel and period, plus defined success metrics and guardrails.
- And a legal review of any contractual pricing constraints on the affected customer segments.
Miss any of these before launch and you're running an experiment you can't interpret, not a test.
About the author: Paul Randall is Associate Director of Strategy at Speero, where he works on growth experimentation programs for B2B SaaS and ecommerce clients. Connect on LinkedIn.
Updated August 2026. The Vista switchback methodology and 95% statistic are drawn from Lukas Vermeer and Joshua Tankard's published work on time-split testing at Vista.




.svg)
