
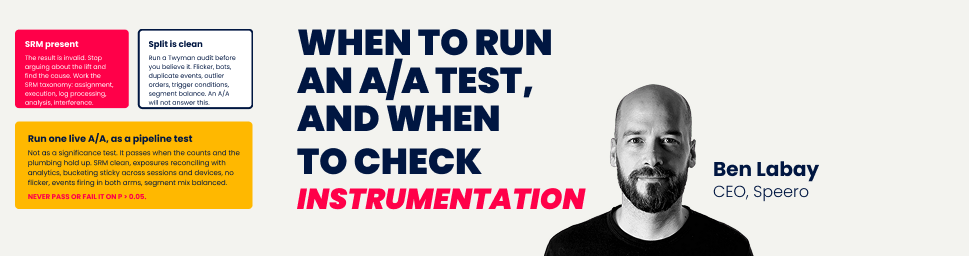
The Diagnosis: A single live A/A test cannot prove your tool is sound. Ruling out a difference as small as 0.1% relative on a 5% baseline conversion rate takes roughly 298 million visitors per arm. The same test also fails on its own about 1 time in 20 when everything is working correctly. Meanwhile the sample ratio check, reading the exact same data, catches a variant quietly losing 1.7% of its users at 30,000 per arm. That check costs no extra traffic and belongs on every experiment you run.
Someone on your team is about to ask for an A/A test.
It usually happens in one of two moments. A result comes back that the room refuses to believe, and the tool becomes the suspect. Or a new testing platform goes in, and running two identical experiences against each other feels like the responsible way to start.
Both instincts point at something real. The instrument they reach for is where it goes wrong.
The version of the A/A test most teams run splits traffic between two identical experiences, waits, then reads a p-value on the conversion rate. That design is close to the weakest way you could spend the traffic. It answers a question you did not ask, and it charges real visitors to do it.
That does not make "never run one" the right answer either. Ron Kohavi gives the A/A test a full chapter in Trustworthy Online Controlled Experiments. His reason is that the tests fail so often in practice, and each failure sends a team back to re-examine an assumption.
Both things about A/A testing are true at once. Sorting out how they fit together is what this piece is for.
The A/A test people run is the weak version
Start with what a passing A/A test actually tells you.
It tells you the test lacked the power to detect a difference. That is a much smaller claim than "the tool is sound," and the gap between the two is enormous.
We ran the numbers. At a 5% baseline conversion rate, at 95% confidence and 80% power, ruling out a difference as small as 0.1% relative takes about 298 million visitors per arm. AB Tasty landed on roughly the same figure, around 300 million, working from the same logic. No program on earth is spending that to check its plumbing.
Now look at what a failing A/A test tells you.
At a 0.05 threshold, 1 A/A test in 20 comes back significant while the pipeline is behaving perfectly. This is the part that does real damage. A team runs one A/A, sees a "significant" difference between two identical pages, decides the tool is broken, and starts distrusting results it should have believed. Georgi Georgiev has been making this objection since 2014, and it holds up. The significance threshold already accounts for that outcome. A rare significant result on an A/A is a predictable event, not evidence of a fault.
The obvious workaround makes things worse.
Teams sometimes propose an A/A/B or an A/A/B/B so they can validate the tool and run a real test at the same time. Every extra arm is another comparison and another chance of a false alarm. The design meant to raise your confidence lowers it.
The A/A test still catches real bugs
The counter-evidence is strong enough to keep the A/A test on the table.
Kohavi's argument is empirical rather than statistical. The idea earns its place because the tests fail so often in practice, and each failure forces someone to look at something they had assumed was fine.
Ian Whitestone documented what that looks like in the wild. A statistical bug that doubled the false positive rate by skipping a multiple-comparisons adjustment. Logging discrepancies between a new system and the legacy one it replaced. Server redirect side effects where bots did not follow the redirect at all, dropped out, and created a sample ratio problem in the process.
Each of those turned up because someone ran an experiment through the whole pipeline and then looked hard at the counts, the logs and the plumbing. The conversion-rate p-value found none of them.
So the fight over whether the A/A test "works" is the wrong fight. Separate the question the A/A test is being asked to answer from the instrument that answers it cheapest, and the argument dissolves.
Read the split, not the conversion rate
If you do spend traffic on a live A/A, the sample ratio check on user counts is a far more sensitive bug detector than the conversion comparison sitting right next to it. Same visitors, same duration, very different resolving power.
Speero calculation. SRM detection uses a chi-square goodness-of-fit test at alpha 0.001 with 80% power. The conversion column is the minimum detectable relative difference on a 5% baseline at alpha 0.05 with 80% power.
At 30,000 users per arm the count check flags a variant quietly losing 1.7% of its traffic. The conversion reading of that identical data cannot see anything under about 10%.
That gap is roughly 6x, and it is the whole argument for making the split your primary read. It is also the argument for running the check everywhere, because sample ratio mismatch works on live A/B tests too, where it costs you nothing extra.
Set the threshold at p < 0.001. Eppo publishes the same default with the reasoning attached. It limits false alarms while keeping power near 100% at realistic sample sizes, and monitoring SRM continuously inflates the effective alpha anyway.
The decision tree
Here is the whole thing on one page. It also lives as a standalone A/A test decision tree blueprint if you want to put it in front of a team.
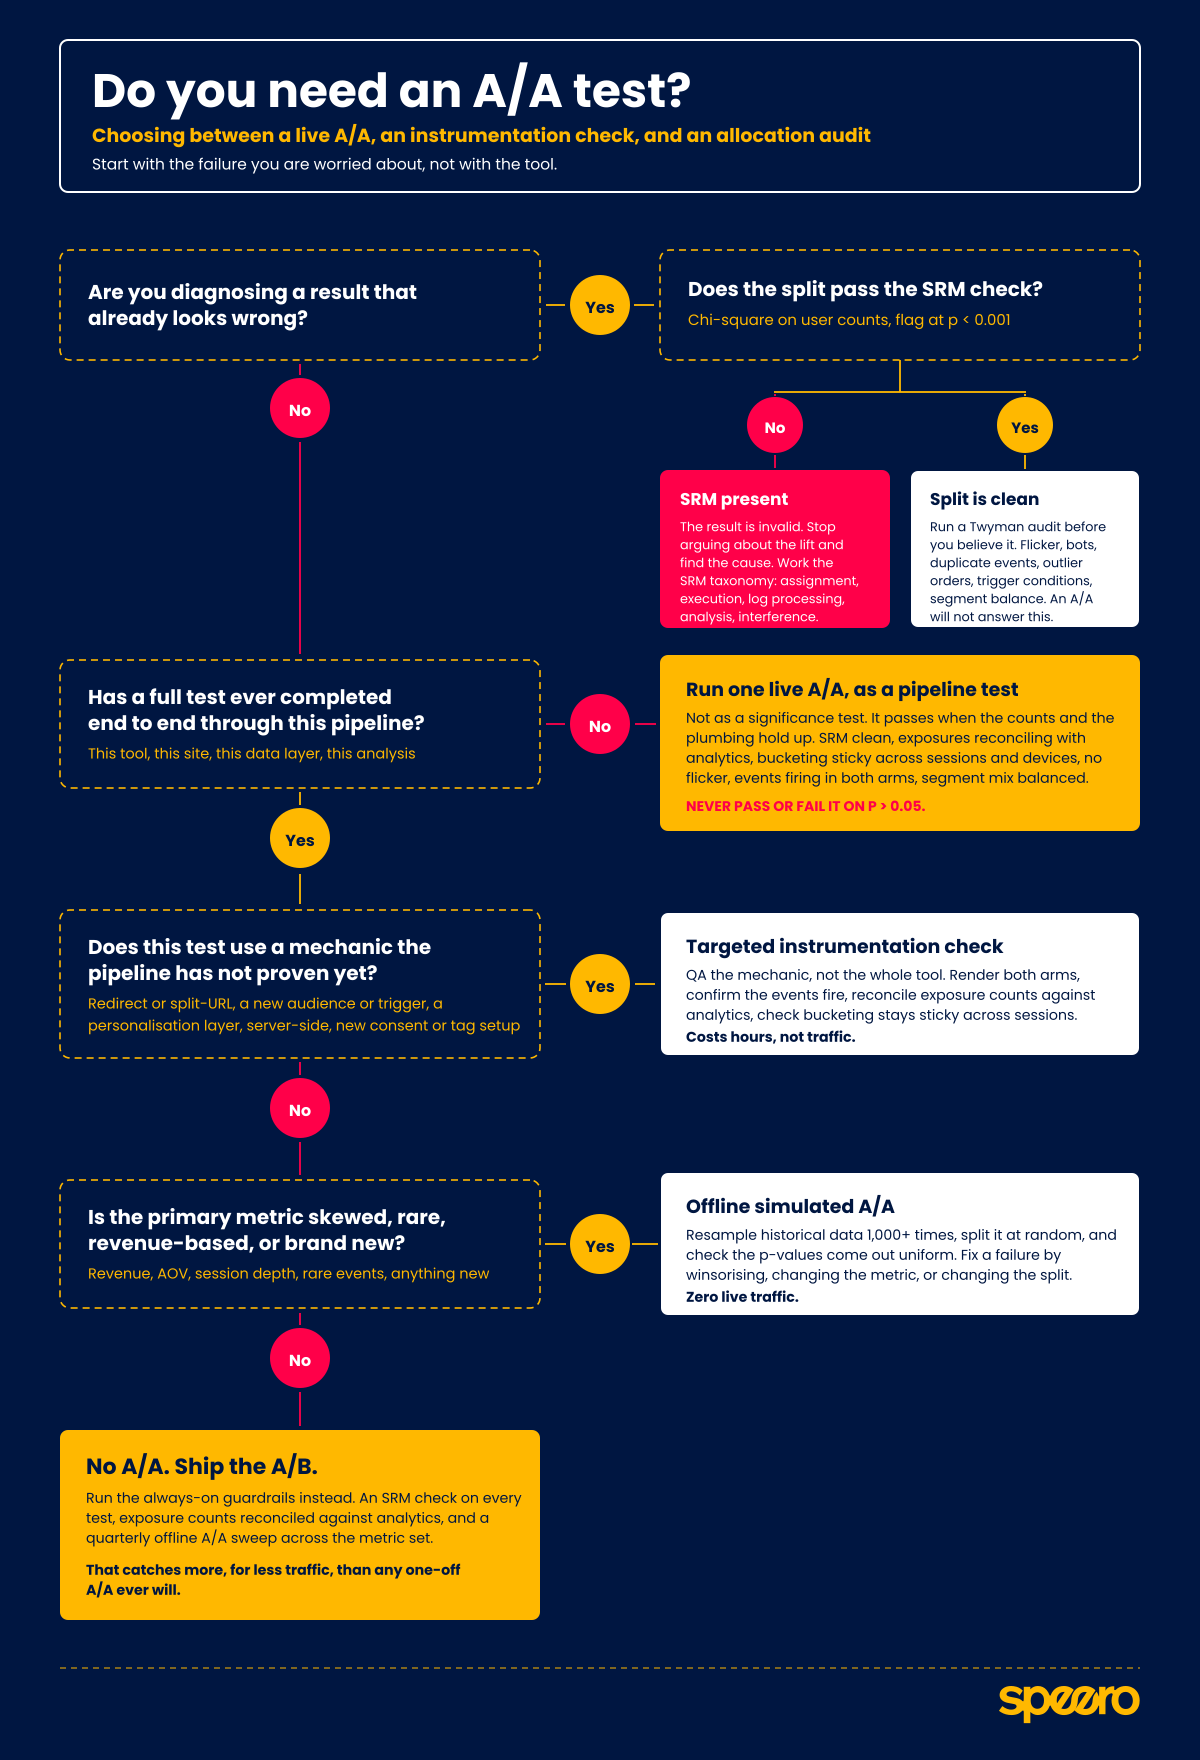
The tree starts with the failure you are worried about rather than with the tool, and it has one diagnostic branch and one pre-launch branch.
If a result already looks wrong, run the SRM check before you discuss the lift. A failing check means the result is invalid and the conversation moves to root cause. Fabijan and colleagues at Microsoft, Booking.com, Outreach and Online Dialogue cataloged 25 distinct causes across five categories: assignment, execution, log processing, analysis, and interference. That taxonomy is your investigation list.
If the split is clean and the number still looks too good, you are in Twyman's law territory. The audit there covers flicker, bots, duplicate events, outlier orders, trigger conditions and segment balance. An A/A test will not answer any of it.
If you are pre-launch, three gates decide it.
Has a complete test ever run end to end through this exact pipeline, meaning this tool, this site, this data layer and this analysis? If the answer is no, a live A/A earns its traffic. Run it as a pipeline test rather than a significance test.
Does this specific test use a mechanic the pipeline has not proven yet? That means redirect or split-URL, a new audience or trigger, a personalization layer, server-side delivery, or a new consent or tag setup. If so, you want a targeted instrumentation check on that mechanic rather than a full A/A. It costs hours instead of traffic.
Is the primary metric skewed, rare, revenue-based or brand new? Then you want an offline simulated A/A, which needs no live traffic at all.
If none of those apply, skip the A/A and ship the test.
When a live A/A earns its traffic
Six situations justify spending real visitors on two identical experiences.
- First implementation. A new tool, or an existing tool on a site it has never run on. Nothing about the pipeline has been observed end to end.
- Migration. Client-side to server-side, a tool swap, or a new personalization or CDP layer sitting between the tool and the page. The tradeoffs between client-side and server-side delivery change what can break.
- Redirect or split-URL testing. A documented SRM source. Bots and some users never follow the redirect, so one arm loses people before anyone measures anything.
- Numbers that never reconcile. The tool's counts and the analytics counts have never agreed and the reason has never been found. That is a plumbing question, and an A/A isolates it.
- Infrastructure change. A new CDN, a new consent management platform, a rebuilt tag container, an SPA re-architecture. Any of these can break assignment without breaking anything visible.
- SRM showing up across multiple tests. A pattern rather than a single incident points at the platform. The Microsoft paper lists exactly this as a diagnostic rule of thumb.
When you do run one, pass it on the counts and the plumbing. SRM clean. Exposures reconciling with analytics. Bucketing sticky across sessions and devices. No flicker. Events firing in both arms. Segment mix balanced. Do not pass or fail it on p > 0.05.
What to run instead, most of the time
Three instruments cover almost everything an A/A gets asked to do, and two of them cost no live traffic.
The instrumentation check is the cheapest. Zero traffic, a few hours of work.
Does the variant render in both arms, do the events fire, do exposure counts reconcile against analytics, does bucketing stay sticky, is there flicker. Most trust problems in a young program are really this problem, and a test implementation checklist resolves them faster than any experiment.
The offline simulated A/A costs zero live traffic too, because it runs on history you already have. Resample your past data 1,000 or more times, split it at random, and check that the p-values come out uniform.
Microsoft's experimentation platform uses exactly this method to validate metrics.
What they found is uncomfortable. The typical product had 10 to 15% of its metrics failing the uniformity check, and for some products the rate hit 30%. Twitch runs a bootstrapped version of the same thing before launching tests on skewed metrics like hours watched, then fixes failures by winsorizing or changing the split.
The live A/A is the expensive one. Real traffic, real calendar time, and justified only when the whole pipeline is unproven.
Rank them that way and the answer to "should we run an A/A test?" is usually no, followed by something more useful.
Where this leaves you
Put SRM on every experiment at p < 0.001, reconcile exposures against analytics as a standing habit, and sweep your metric set with an offline simulated A/A once a quarter. That combination catches more, for less traffic, than any one-off A/A ever will.
Save the live A/A for the six moments that earn it, and read it on the counts.
If you want to work out which of the three checks your program is missing, that is the kind of thing our experimentation program advisory clinic is built to answer. And if you are still choosing a platform, the A/B testing tools comparison covers 30+ options and how they handle validity checks.




.svg)
