
When evaluating experimentation programs, too often testing is wasted on running too many tests that are pushed by HIPPOs and poorly prioritized processes. The results are—ineffective programs, inconclusive results, and lack of momentum. Even with enough traffic, programs can fall foul to basic mistakes which reduce the value of the entire program and ultimately lead to the program not generating valuable insights that drive the business forward.
You need to be clear about WHERE and HOW to test, and what kinds of tests are needed to really get the results that matter.With revenue and velocity benchmarking, you can easily answer why one area of a site should be tested over another in ways that any business understands. Maximizing ROI and revenue.
This approach removes the political hot potato of distributing tests across teams evenly like democracy and uses a laser focus to ensure that testing is only done in areas with the potential to generate the most return. We’ve found it’s one of the ways to cut through the noise and misnomer of experimentation and see it for the revenue-generating tool that it is.
Conversion rates, running lots of tests, getting a bunch of different teams to participate, etc are all great, but your boss and their bosses speak in dollars. This way of thinking is a great way to translate an experimentation program's language into one anyone in your company can understand.
In fact, we’ve been running this exact process for hundreds, maybe even thousands of clients and leads. It is the foundation of our testing programs and the bread and butter service of managed testing. Speero uses it almost every day.
This program is designed for eCommerce websites. Leadgen B2B websites require a more complex approach, for which we’ll make a post soon.
Know Your Test Duration, Sample Size, and MDE
Our process starts with the basics. You’ll need to determine your sample size, test duration, and MDE (Minimum Detectable Effect). Find and write down the traffic and conversions of the key pages on your website or app you want to test.
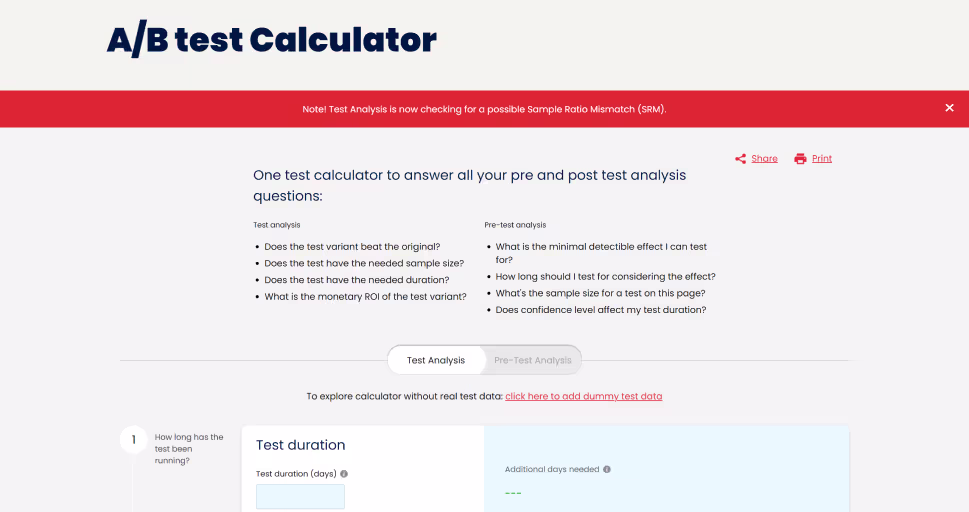
Then, find yourself a good A/B Test Bandwidth Calculator. You’ll need a calculator that can calculate sample size, test duration, statistical significance, confidence level, and Minimum Detectable Effect. Why?
First of all, it’s going to be hard to keep track of three tabs and two napkins every time you need to measure sample size and test duration. Second, the problem with using simple A/B test calculators is that you have to combine them. Since you don’t know the statistical methods each one uses, you can end up with unwanted results.
If you run a sample size calculation on one sample size calculator, then switch to another calculator to estimate the test duration, you will get conflicting results. This happens because of the differences in underlying statistics the calculators use. If you aren’t aware of this or why it happens, you’ll end up conflicted and frustrated.
Having consistent yet convenient, centralized calculators is necessary not only for running efficient testing programs but also for avoiding getting different results. Obviously, at Speero we use our own A/B Test Bandwidth Calculator. And not just because its ours, but because it is centralized and includes all the data points we need.
How To Calculate the ROI of Experiments
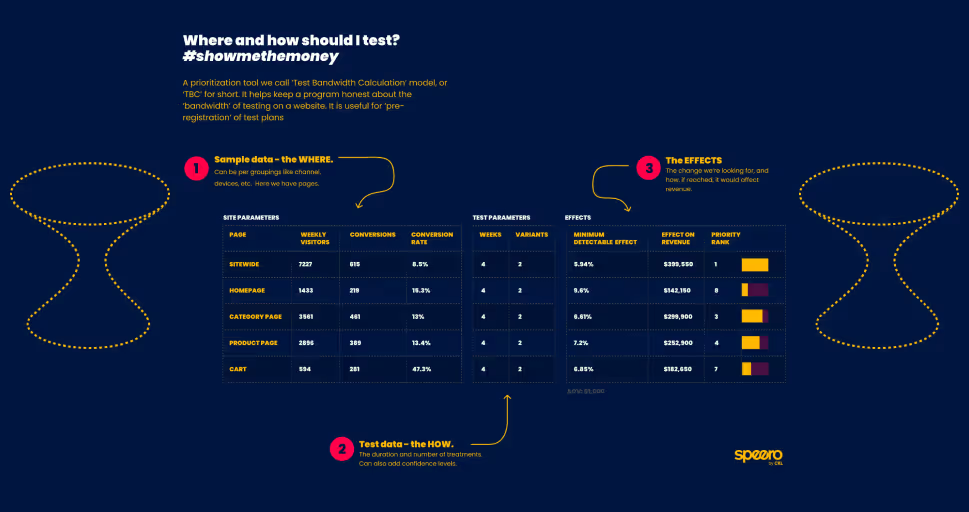
Now that you know your sample size, test duration, and MDE, it’s time to calculate the ROI of your tests. For this, we will use Speero’s — Where and How Should I Test to Make the Most Money Blueprint. This Speero’s Blueprint is a prioritization tool we call the ‘Test Bandwidth Calculation’ model (TBC).
TBC lets you determine if you have enough traffic for A/B testing based on traffic and conversion volumes and if it’s possible to run experiments with smaller impact or just focus on high-impact experiments higher in the funnel.
But even more, Speero’s Test Bandwidth Calculation model lets you determine the ‘Effects on Revenue’ (ROI) for A/B testing on different web pages, channels, or devices. How? TBC calculates ‘Effects on Revenue’ based on this formula: Average Order Value * Additional Conversions (based on increased CVR).
But what are Additional Conversions here? Basically, MDE, or how many more conversions would be achieved if MDE is reached. Here’s how the process works;
1—Download Where and How Should I Test to Make the Most Money Blueprint and create your own Gsheet or Excel table that’s based on Speero’s blueprint.
2—Take the data (traffic and conversion) you’ve collected and enter them in your A/B Test Calculator. Take the data from the calculator and fill in the following fields:
- Sample data (The WHERE you test) — Page/Channel/Device, conversions, conversion rate, and weekly users/sessions.
- Test Data (The HOW you test) — Duration and number of treatments. You can also add confidence level here if you’d like
- The Effects — This is the change you’re looking for and how, if reached, it would affect revenue. Enter MDE you got from your calculator, and the formula for ‘Effects on Revenue’: Average Order Value * Additional Conversions.
Now, you know how much revenue you can get by experimenting on different channels, pages or devices. On to the next step.
How To Prioritize Your Tests Based on Revenue
Once you’ve calculated your sample size, MDE, and testing ROI you can pull from channels or pages, it’s time to prioritize your testing on ROI.
First, prioritize your testing on the ROI you can get from channels, devices, or pages. Obviously, prioritize those channels with the most ROI. But the battle isn’t over yet. You need to select tests with impact in those channels/devices. How?
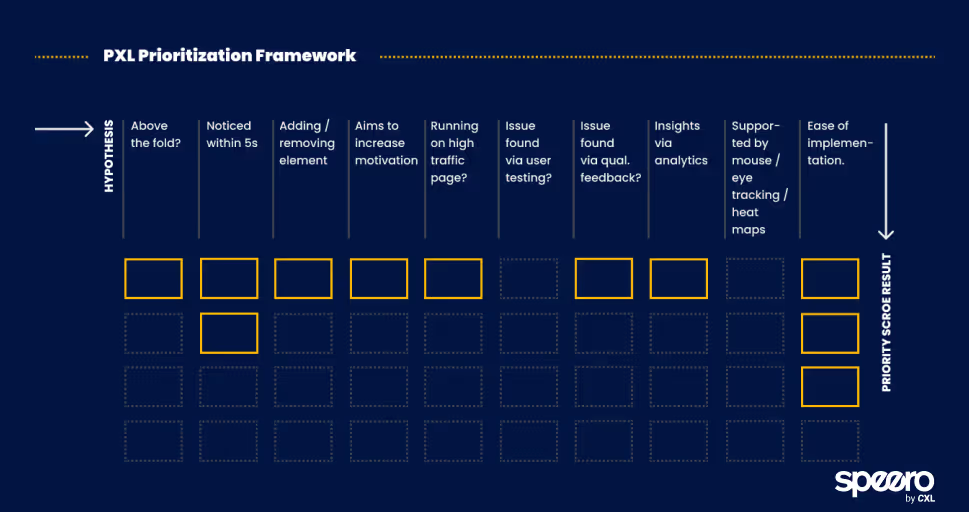
By prioritizing your tests on some objective impact model like ICE, PIE, or PXL.
Naturally, we recommend using Speero’s own PXL. Not because it’s ours but because ICE and PIE models are subjective, based on people calling the shots about the changes. However, the PXL model has more objectivity and nuance by asking questions like:
- Is the change above the fold?
- Is the change noticeable in under 5 seconds?
- Is the test supported by user research, qualitative feedback, or data analysis?
Questions like these provide more objectivity to the model while positive answers to them increase the chances of the test having an impact.
ICE and PIE models are subjective, based on who’s calling the shots about the changes. But the PXL model is more nuanced, with added questions like
— Is the change above the fold? Changes above the fold are noticed by more people, thus increasing the likelihood of the test having an impact.
— Is the change noticeable in under 5 seconds? If not, it’s likely to have less impact.
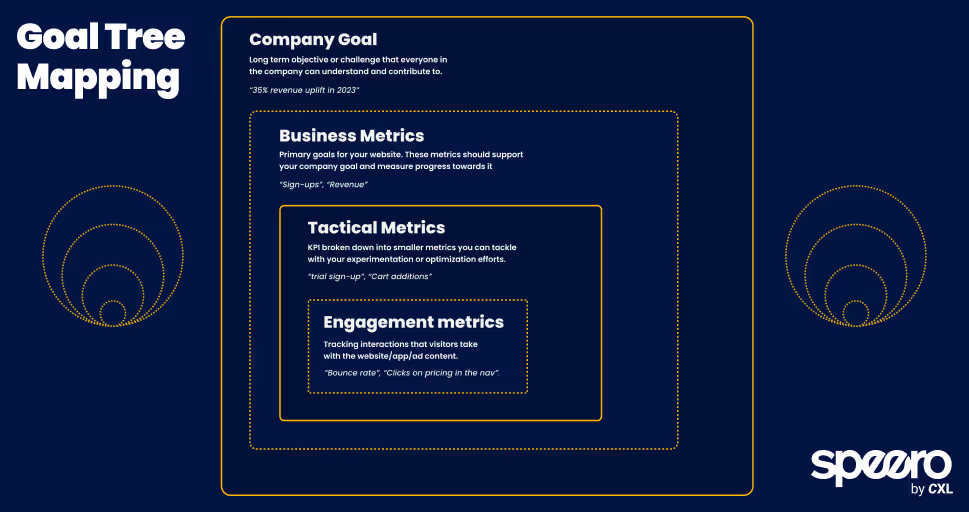
Another great blueprint that can help you with prioritization is the Goal Tree Mapping Blueprint. It lets you connect broader, strategic KPIs (35% more revenue in 2023) with tactical (add-to-cart) and engagement (bounce rate, etc) metrics. This way you can break bigger KPIs into smaller metrics where you can see impact quicker.
How To Create a Test Program Planning Guide
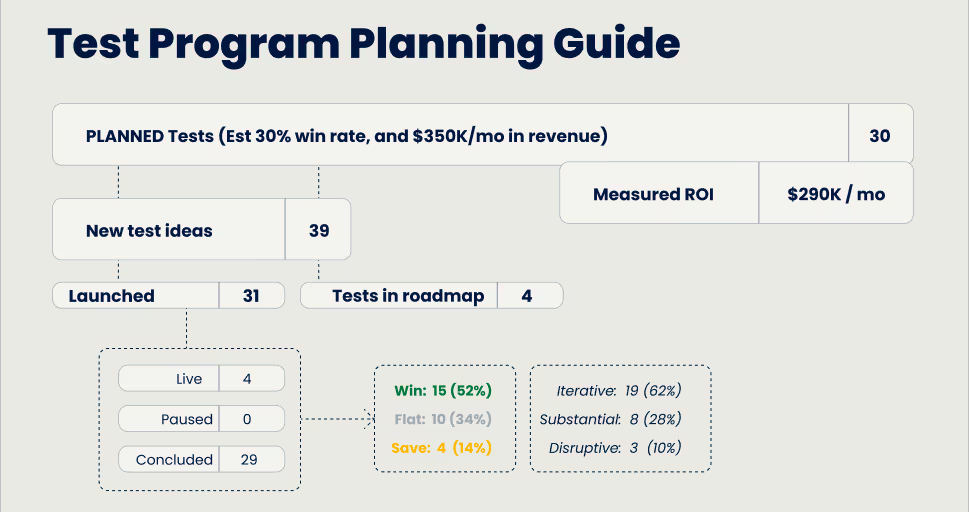
its time to create your Revenue Testing Program for a quarter. Take a look at the picture above. This is how we’ve created Speero’s quarterly Revenue Testing Program for hundreds of our clients. We present these plans as plan cards, as you can see.
With plan cards like these, you get a communication tool that can truly create a culture of experimentation, since revenue can be the ‘Rosetta Stone’ to align different functions and silos and help them relate to each other.
When you’re able to track experiments and revenue from them across various functions, you create a pillar (revenue) everyone can touch and tell their story around. Now, for the process itself.
The first thing to do is to determine how many tests you’re planning for the quarter. This mostly depends on your testing velocity. If you got problems with it, check out “How to Run a High-Velocity Testing Program”. Second, determine your win rate. We keep our win rate at 50%, but you’ll have to check your testing history to see yours.
Hint: It doesn’t matter if your win rate is 25% or 50%. You can’t forecast which test will win, and this isn’t why we’re doing them anyway. One more thing — better to err on the lower side of your win rate. Better say your win rate is 30% and then show 50%, then the other way around. Under promise, overdeliver.
With planned tests, win rate, and ‘effects on revenue’, you’re now able to forecast the ROI of testing on specific channels. You’re able to say: “We plan 30 tests with a win rate of 30%, which we expect to add $250,000 of monthly revenue.” The second part of filling up these plan cards comes once the quarter ends. Write down the number of:
- Launched tests.
- New test ideas.
- Live tests.
- Paused tests.
- Won tests.
- Flat tests.
- Saved tests.
The main part is writing how much revenue was made with concluded tests. Now, you’re able to say: “We planned 30 tests with a win rate of 30%, which we expect to add $250,000 of monthly revenue. However, the program actually achieved $290,000.”
This way of communication is powerful. With revenue testing program plan cards like these, you help your managers and leaders do their job. Because with them, they can see experimentation through lenses they know and understand.
Keep in mind that in this process, we didn’t use the ‘save’ language. How much you saved and derisked your company. But feel free to add this part to your analysis, especially if flat tests are your ‘real enemy’. There’s also the testing portfolio balance on this card, which we didn’t explain (if you noticed). We will talk about down below.
How to Create Experimentation Impact Over Time
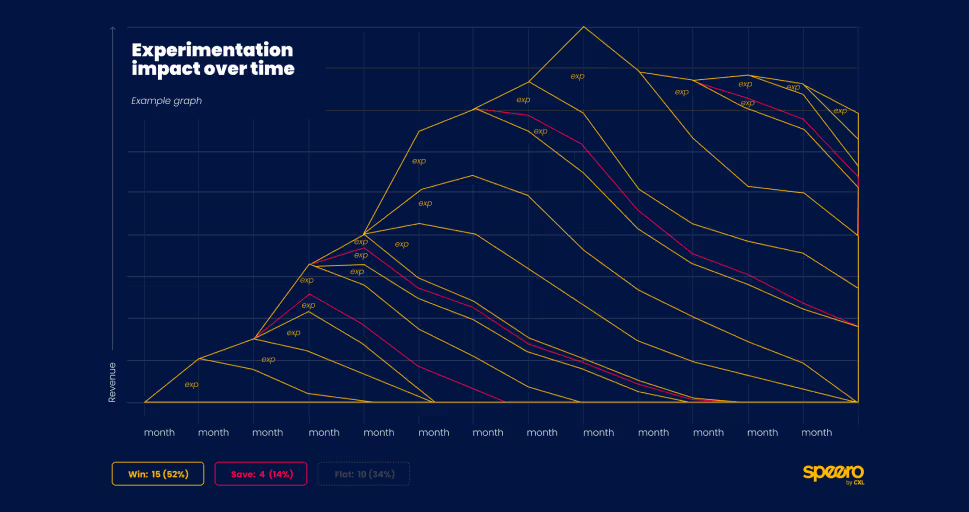
Adding the ‘Experimentation Impact Over Time’ graph to your test program plan card let’s you further communicate what your program achieved in the language your C-level knows and loves: revenue. One more way to prove that your experimentation is profitable.
‘Experimentation Impact Over Time’ will also help with your decision-making. This way, you also measure the ROI impact, program’s success, and effectiveness of your strategies.
More importantly, when you evaluate the direct contribution of your individual experiments, you can determine where you should allocate your resources based on effectiveness. This ultimately leads to data-driven decision-making.
We’ve used this with almost all of our clients, with great success. Everyone likes to talk in revenue. How to make it?
1—Collect the data: Tests you ran, their ROI estimates, and results decay model (e.g., a 25% decay after 3 months).
2—Create a chart with revenue and time. As you can see from the image above, you’ll end up with a simple yet powerful graph card to show to your leadership.
You should also check out Speero’s “Testing Revenue Model” Blueprint which we used to create this part of the post.
How to Make Individual Test Cards with ROI Estimates

The last card you want to create is the card for individual tests. When you standardize how you present your tests, like with these cards, you’re able to communicate the impact of your experiments better and faster to your leadership. Remember, the C-level has the least time of us all. They want information they can consume easily and fast.
These cards are something Speero uses for all our clients, with great effects in showing the impact of individual experiments. They become even more powerful when you add estimated monthly monetary contributions from individual tests on them. Let’s see how. Enter the following data:
- Test data and results—The duration and number of treatments, opportunity, hypothesis, even confidence levels, and ultimately, outcome or takeaway.
- Estimated monthly monetary contribution—the formula is: Extra transactions * AOV.
- Potential effects—the change you were looking for, and how, if reached, it would affect revenue.
These cards may not look special, but that’s where their power lies. They give you a standardized and lightning-fast way of presenting your findings.
Revenue Trap 1: Unbalanced Portfolio
Basing your testing on revenue alone can lead to an unbalanced portfolio and you following ‘perverse incentives’. ‘Perverse incentives’ happen when the incentive, in our case revenue, has undesirable or unintended consequences contrary to original intentions. If you place revenue as your North Star metric, you could start focusing too much on:
- Lower-risk tests in higher traffic areas.
- Tweaking inside a local maxima instead of finding a new approach.
- Exploitation, rather than exploitation plus exploration.
The worst part is focusing only on tests that ‘win’ revenue, and thus stopping iteration and failure. Big wins sometimes await you after several iterations, but how will you reach them now? There are two things you should do to avoid this.
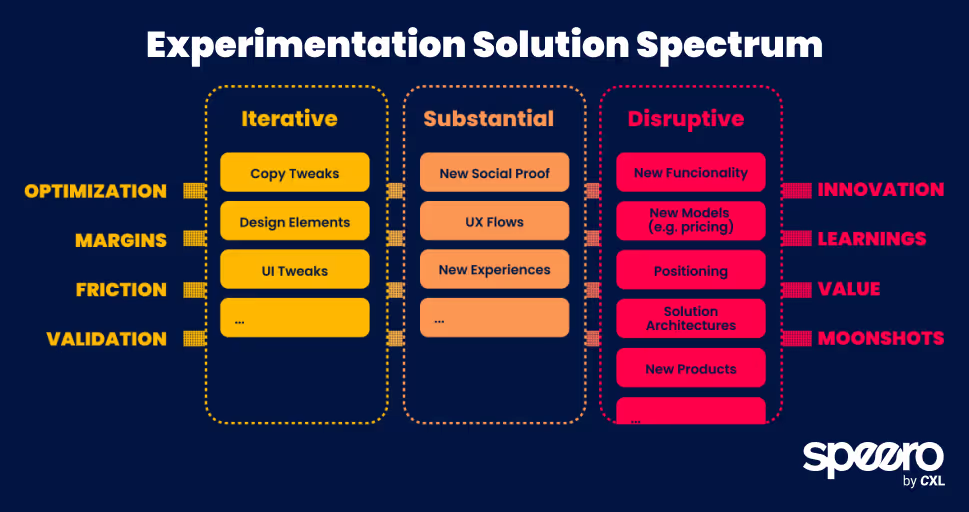
First, you could balance your testing portfolio. Tag your tests by their level of disruptiveness. By how many small, medium, and big bets your team is making.
- Iterative: small tweaks and iterations of UX, UI, copy, and design.
- Substantial: bigger, substantial best involving new social proof, UX flows, or user experiences.
- Disruptive: where you make big, risky bets with functionality, messaging, pricing, positioning, products, etc.
Then, try to balance all three in your testing. We balance ours with Speero’s Experimentation Solution Spectrum Blueprint. As you can see from the image above, we also separate ours by other tradeoff spectrums(categories) like:
- Optimization vs Innovation
- Margins vs Learnings
- Friction Vs Value
- Validation vs Moonshots
Tagging your tests by their disruptiveness lets you see if you’re overly focused on the quantity or quality of your tests. Also, if you’re too much iterating yourself in the corner or have reached the local maximum. Keep in mind that big, disruptive tests make you sacrifice velocity.
On the other hand, too much iterative testing will never lead you to big, innovative wins. Diversifying your testing portfolio like this ensures you’ll cover more ground and defend your assets.
The second thing you can do is to have a method or framework that lets you decide when to iterate more and when to stop. Speero has our own Iterate Vs Move On Blueprint precisely for solving these decisions.
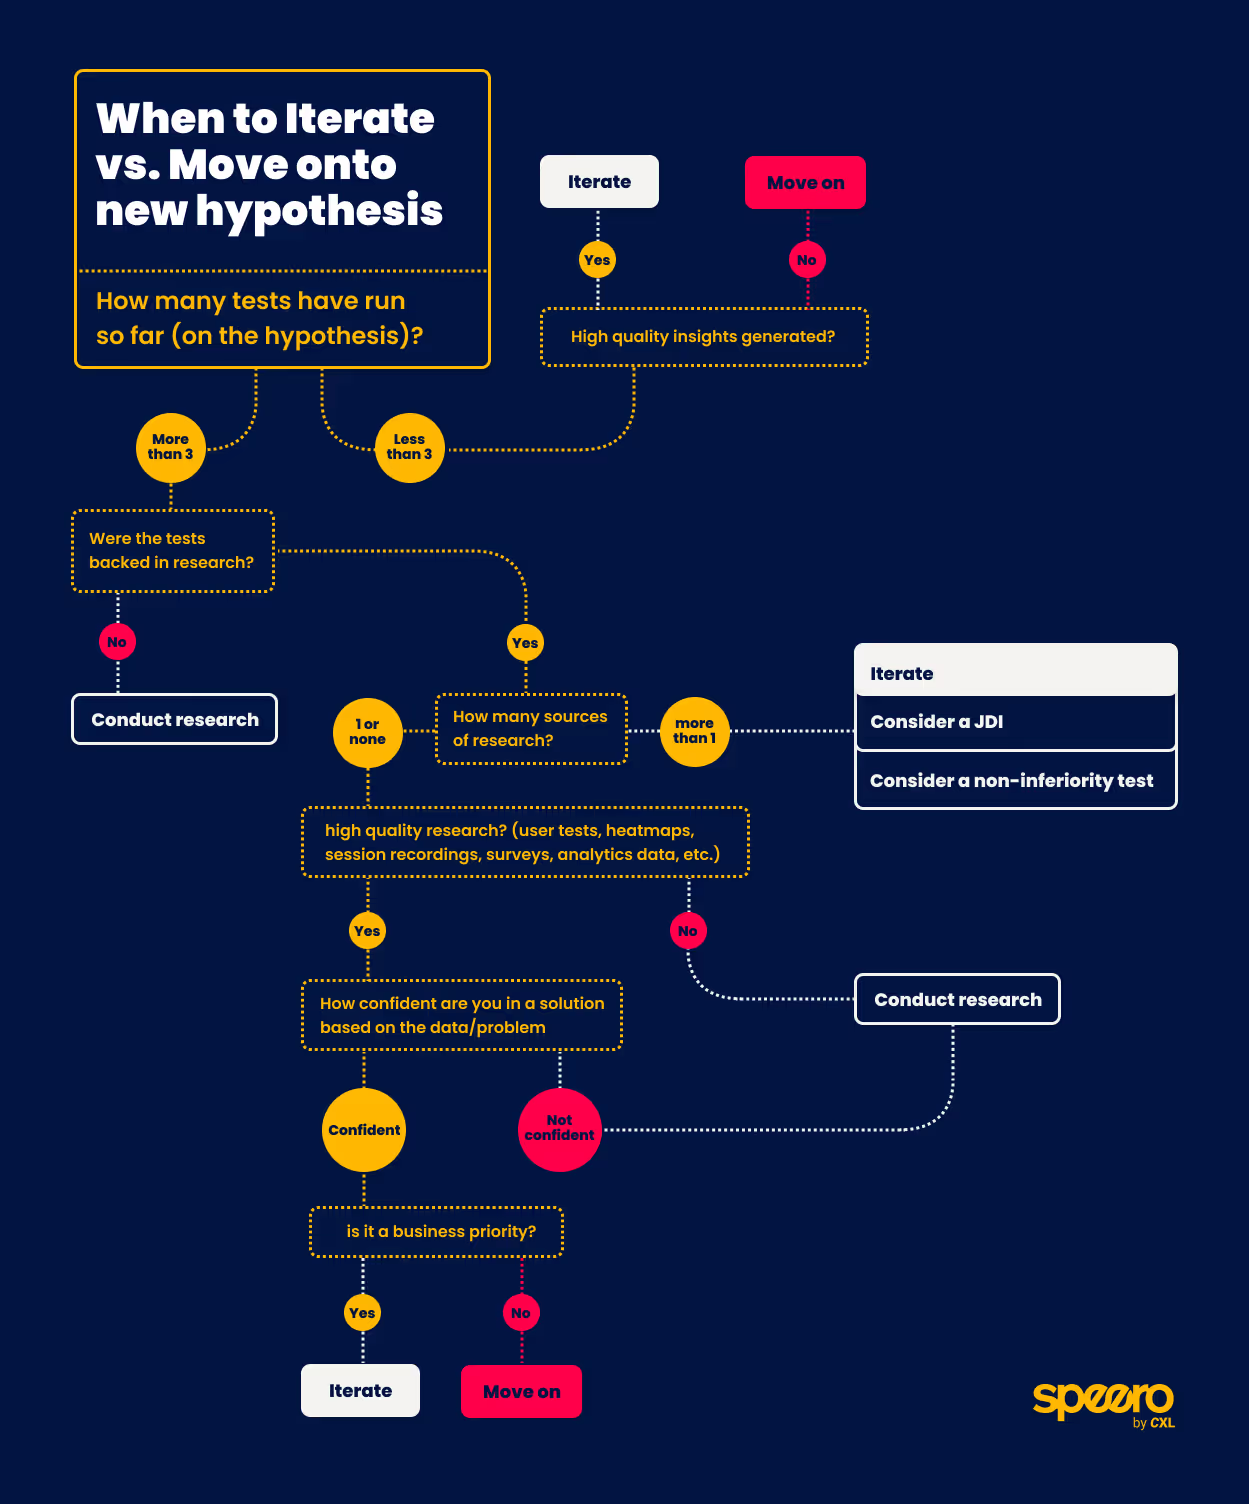
Speero’s own philosophy and this blueprint make us focus a bit more on iteration. Why is that? Because most of the time, building something new costs a lot more than iterating, especially from the web dev side.
Even more, when you think about iterations from the revenue perspective, they do let you squeeze the juice until it’s all gone. On that topic, if there’s still some juice left to squeeze—you’ve run three tests, but are still generating high-quality insights and tests—continue to iterate. There’s still some juice left. Also, if it’s a big business priority, continue iterating.
On the other hand, if your tests weren’t backed by research, high-quality research, or enough research sources, it’s time to run (more) research. Your iterations and program will thank you. Investing a bit more in research can help you understand where to iterate instead of just pulling ideas out of a hat or copying the competition.
You should incorporate this framework (or any other you’re using) into your prioritization framework. Because Iterate Vs Move On Blueprint does deal with prioritizing tests. But keep in mind that you shouldn’t just copy both frameworks but adapt them to your business needs, resources, and more.
Revenue Trap 2: Ruinning CX, LTV, and Retention in the Process

Imagine — you increased the conversions and revenue on your site. The bosses are happy. You did this by pushing promotions, countless ‘growth hacks’, and discounts. You placed numberless pop-ups, surveys, cross-sells and upsells. Every product is available for a limited time or in limited amounts. You boosted revenue all right. But at what cost?
Your site looks like a casino. The brand is ruined. You attracted all the wrong kinds of customers—promotion lookers, discount searchers, and churners. The profit margins are becoming lower. And the bosses are starting to notice.
Without realizing it, you’ve created a monster. More revenue and conversions don’t mean more profit. At least, not if you don’t take care of customer experience, LTV, and retention.
To impact these metrics you need to optimize the whole customer journey:
- Awareness
- Consideration
- Buying
- Retention
- Advocacy
- (Or whichever model you use)
After all, nothing exists in isolation, including your website. The customer experience doesn’t begin and end with your website but includes experiences like using the product, after-sales care, delivery, and more. While you’re focused on revenue, think about these questions as well:
- Was the delivery fast?
- How was the delivery experience?
- Does the product live up to the claims?
- How is the customer support experience?
- Do you ask for repurchases when there’s a reason for them?
While revenue focus lets you speak the C-level language and… get revenue, a simultaneous focus on customer experience ensures you aren’t leaving revenue on the table in other parts of the journey. And ruin things for customers and the brand in the process. The best experimentation programs go beyond the website and conversions to explore wider questions like CX.
Don’t Be Afraid to Lead With Revenue
The point of this post was to show there’s nothing wrong with basing your program on revenue. You only need a couple of items to do this—some analytics, a good A/B test calculator, and a couple of templates and frameworks. The only thing to worry about is that you don’t ruin your testing portfolio and customer experience in the process.
But creating a revenue-based program is still possible, if not preferable. Speero has done this for hundreds of clients and leads. It’s the bread and butter of our experimentation programs and managed experimentation. We’ve used this almost every day. Try it yourself.
Still don't know where to start with benchmarking your program? Our experts can help. We've benchmarked the programs for hundreds of leads and clients. It's one of the foundations of our program.


.svg)
