I run Speero, and recently I led a training session for one of our client teams.
I called it "the art of the decision" and tweaked the deck all week (I really like this topic).
I opened with a quick shopping question.
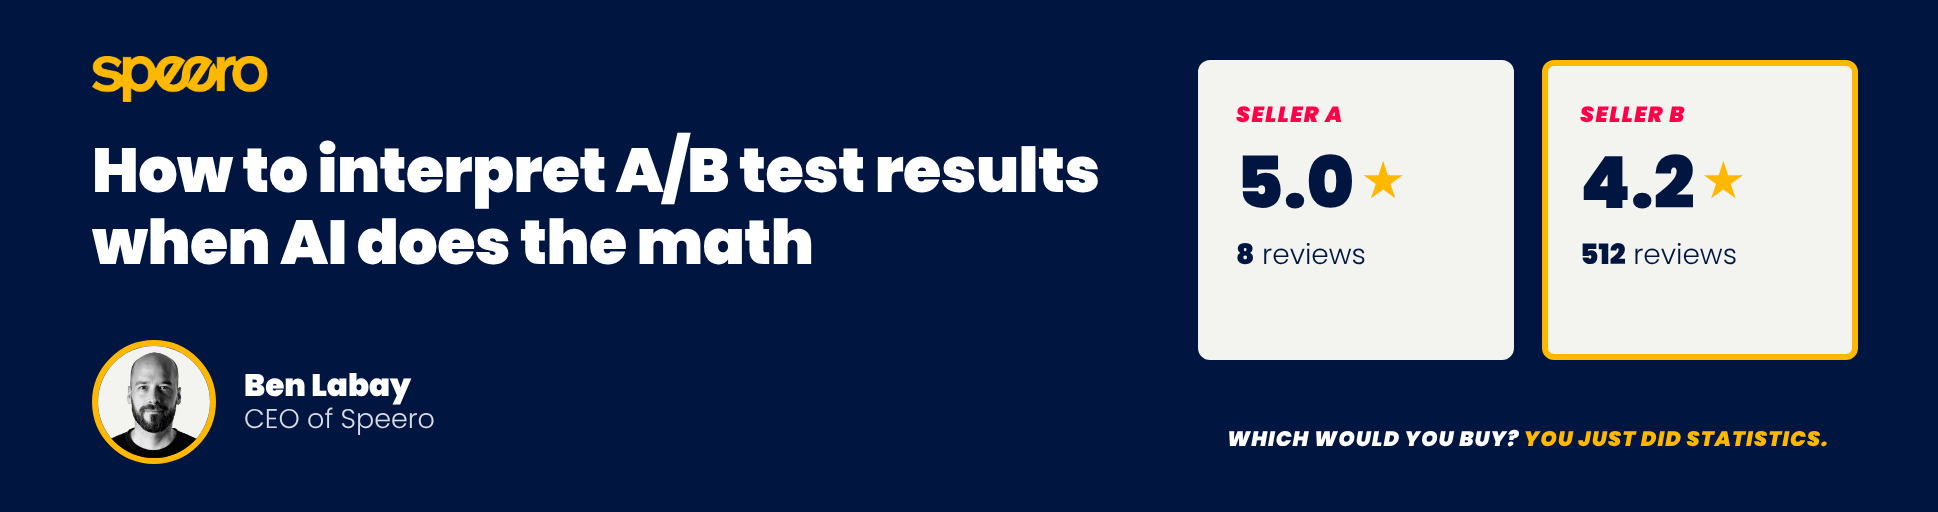
Two sellers list the same phone case at the same price.
Seller A has 5.0 stars from 8 reviews. Seller B has 4.2 stars from 512.
Almost everyone picked B.
No one opened a calculator. They weighed how much evidence each seller had, how big the gap was, and what a bad pick would cost.
Then I swapped the phone case for a washing machine. You gamble on a phone case with free returns. You want more proof before you buy a washing machine.
Every time you read star ratings, you're doing statistics. Interpreting A/B test results asks for the same three judgments.
Cost is the one teams misjudge. Standard test settings accept a 5% chance of a false alarm and a 20% chance of missing a real win. Most teams only fear the first.
AI now does the arithmetic of a test. An agent can pick the metrics, size the sample, set the run time and put a range around the result.
The judgment around that arithmetic is still yours, because the tool doesn't supply the rigor. It comes down to five questions no agent can answer for you.
The system does the sums and you make the call
A tool can compute a lot. It can tell you which pages can carry a test, how small a change each one can detect, how long the test must run, and whether you've tested the idea before.
At Speero we keep those answers in a scenarios table for each program, with a row for each page and device. It's sort of a financial model plus a metric protocol/playbook reference. It's built on our test bandwidth calculation, and you can run the same sums in a free A/B test calculator.
I've written before about how we size tests with scenario rows.
The other half of the work has no computed answer. These need to come from humans and work culture (what the org tolerates):
- What decision is this test for?
- How sure do you need to be?
- What will you do with each possible result?
- What must not get worse?
- Do you believe the result?
The answers depend on what your business cares about and what a wrong call costs it.
I care about that list because of speed. I credit most of my professional success, in academia and then running an agency, to high decision velocity.
Speed and certainty trade against each other, and I'd argue speed matters more. A wrong decision still teaches you something, and then you can pivot.
1. What decision is this test for?
Start with the claim. A superiority test asks whether the new version is better. A do-no-harm test, also called a non-inferiority test, asks whether it's no worse than a small loss you've agreed to accept.
Use do-no-harm for changes that will ship for another reason, like a shared template, a brand or legal change, or a cheaper tool.
The sums differ between superiority and do-no-harm testing, so tell your agent which one you're running at intake. Set the loss margin before launch and leave it alone afterward.
Then separate what happened from what you'll do about it. Every test record gets a result field (win, flat, loss or error) and an action field (fully implement, partially implement, iterate, relaunch or abandon).
A win can end in iterate. A flat test can end in fully implement, as with a rebrand that only had to hold your numbers.
The Results vs Action blueprint keeps them apart because the result doesn't pick the action. Track both rates. A program with a high win rate and a low action rate is producing slides.
2. How sure do you need to be?
There are two ways to be wrong about a test.
| False alarm (false positive) | Missed win (false negative) | |
|---|---|---|
| What happens | A change that does nothing looks like a winner (or a loser) | You drop something that works |
| How often, at standard settings | 1 in 20 | 1 in 5 |
| What it costs | Build time, a page that may be worse, a false lesson in the record, or a good idea dropped for nothing | Leads you never get, a good idea marked as dead |
Swipe to see all columns →
Standard settings mean 95% significance and 80% statistical power. The 1 in 5 assumes the change works at the size you planned for. On low-traffic pages, or when the real effect is smaller, the miss rate climbs higher.
The missed win is the more common mistake by design. It's also invisible, because no one gets blamed for a lead that never arrived.
Most teams only fear the false alarm, so they hold every decision to 95% and wait. On pages with modest traffic, most tests then end as inconclusive results and nothing ships.
One person in the session, who runs a cautious program, said this about false alarms.
"We should be taking more risks but it's not really a risk because it's a really tiny risk."
A false alarm still has a cost. Most are harmless, some are slightly worse than what you had, and each one puts a false lesson in the record that later tests get built on.
Certainty has a price too. Detecting a 10% change takes about 4 times the traffic of detecting a 20% change, and a 5% change takes about 15 times. (That's an illustration at a 3% baseline, 95% significance and 80% power.)
On a page with modest traffic, a small copy change may never be readable. A preference test is the better tool for that call, and substantial and disruptive changes are the cheap way to get a readable A/B test.
Two questions set the bar. How easy is the change to undo, and how bad is it if you're wrong?
CTBC is the probability that the variant is better than control. "There's an 88% chance the variant is better" is easier to act on than a p-value, and p-values are among the most misread numbers in testing.
| Bar | CTBC | Fits |
|---|---|---|
| Fast-track | 80%+ | Ship at 80% or above. Easy to undo, low impact if wrong. Labels, copy, the layout of one element. |
| Standard | 90% | Above 90%, ship. From 80% to 90%, note the direction and consider a follow-up. Below 80%, call it flat. |
| Hold for rigor | 95%+ | Hard to undo, high impact. Lead routing, pricing, a rollout to every brand. |
Swipe to see all columns →
My own habit is to set the sample size with frequentist math and then read the result as a CTBC.
One catch. CTBC is one-sided, so a 95% CTBC is a lower bar than 95% significance (it's closer to 90%). The same result can clear one and miss the other.
The table is adapted from my colleague Paul Randall's piece on why one confidence bar fails. Agree the bars before anyone sees results, then write them into your agent's instructions so every readout uses them.
To agree them as a team, list 6 upcoming decisions and have everyone vote fast-track, standard or rigor. The items where the votes vary show where your risk tolerance hasn't been agreed yet.
3. What will you do with each possible result?
The Experimentation Decision Matrix pairs each combination of primary and secondary metric results with an action. Fill in your own version before launch.
Take a made-up example. A software company tests a shorter demo request form. The primary metric is demo requests, the guardrail is qualified demos, and the claim is superiority.
| If you see | You will | Because |
|---|---|---|
| Requests up, qualified demos flat | Fully implement | Primary win, guardrail flat. Roll out and record the range. |
| Requests up, qualified demos down | Iterate | Primary win, guardrail loss. Only a rise in qualified demos changes this. |
| Requests flat, wide range | Iterate | Flat on a superiority test. Check that visitors saw the change, then try a bolder version. |
| Requests down | Abandon | Primary loss. File what the hypothesis got wrong so no one repeats it. |
| Requests up by a third in week 1 | Check first | Too good to trust yet. Check the split and the tracking. If either is broken, fix it and relaunch. If both hold, run to the planned end date. |
Swipe to see all columns →
Name who signs off on each action. For the two iterate rows, our framework for when to iterate versus move on helps you judge how many more rounds the idea deserves.
Even the more advanced programs we work with often skip this step, and I don't have a prescription that makes it happen every time. An intake agent helps, because it can draft the table from your metric choices while the idea is still being logged. My colleague Alexander Loesch has written up how Speero builds its AI skills.
4. What must not get worse?
The second row of that table is the reason guardrails exist. Demo requests went up and qualified demos went down, so the primary metric won while the number the business cares about may have dropped.
Pick the guardrail metric before launch and agree a number with it. How much of a drop in qualified demos will you accept for a given gain in requests?
Read segments the same way. "It won overall but lost on mobile" is a reason to iterate. "It won on mobile" alone is a hypothesis for the next test.
The primary metric you wrote down is the one that decides, so don't change it after launch.
5. Do you believe the result?
My test for belief comes from Yuval Noah Harari's Homo Deus.
Knowledge = Experiences × Sensitivity
My 11-year-old son tried wine for the first time and called it horrible. I asked him if he knows wine now, and he said yes.
He has a single experience and no sensitivity, and the two multiply. A zero on either side makes the knowledge zero.
In a test, sample size is the experiences side. Sensitivity is how small a change the test can pick up, and whether you set the rules before you looked.
Your agent will hand you a number either way. Four habits stop you from believing it too early. (The figures are illustrative.)
- Ask for the range. Say each version gets 10,000 visitors, control brings in 200 leads and the variant 240. The headline is +20%, and the range at 95% confidence runs from about 0 to +45%. Report the range and plan on the low end. A result that isn't significant still has a range, and unclear is a different finding from no effect.
- Look at the count under the percentage. On a page where nothing changed, 20 leads a week can swing by about ±45% from ordinary noise. At 2,000 leads it's about ±4.5%. Small samples are one of several ways data can deceive you.
- Distrust the surprise. A giant lift from a small change is usually a broken test, a rule known as Twyman's law. Have your agent check for sample ratio mismatch on every result, which is why we argue you should run an SRM check on every experiment, and validate the experiment tracking before it reports a win.
- Expect the win to shrink. A result that barely clears the bar on thin traffic is usually overstated, which statisticians call the winner's curse. A month-long test also measures only a slice of everyone who could visit, so "it won by 12%" doesn't mean 12% more leads a year.
Don't add up headline numbers across tests, because leadership will hold you to the total. Before a wide rollout, confirm the win with holdouts or flip tests.
When someone needs a revenue figure, measure every test the same way so the estimates can be compared. Our blueprints on how to structure reporting across tests and the testing revenue model show how.
Rules to give your agent while the test runs
An agent connected to your testing tool and your team chat can check a live test every week. Give it these five rules.
- Check the traffic split first, every time. A broken split means the result can't be trusted.
- Run whole weeks, 2 at minimum. Weekdays and weekends behave differently.
- Don't stop early on a good week. Run to the planned end date.
- Don't extend a test because it's "trending toward significance". It met the rules set before launch or it didn't.
- Treat segment findings as ideas for the next test.
Looking at a live test is fine, and it's how you catch broken ones. Deciding on what you see mid-test is the problem.
I bend these rules all the time. A code freeze arrives before the planned end date, and you take the data you have. I do it when the change is easy to roll back and a wrong call is cheap.
What changes when the rules come first
When you already know what you'd do with a win, a loss and a flat result, interpreting the A/B test result gets easy. You find the row you landed in and do what it says.
Low-risk changes stop waiting behind a 95% bar, so more of them ship and you learn faster.
Your agent can compute everything about a test except what a wrong call costs you, and that cost decides every row of the table.
Start with a single test in your pipeline. Answer the five questions in its test record, which takes about 30 minutes. Then ask your tool for the smallest change the page can detect and how long the test must run.
Want to see how your program's process for calling tests compares with others? Speero's free experimentation maturity audit takes about 11 minutes.